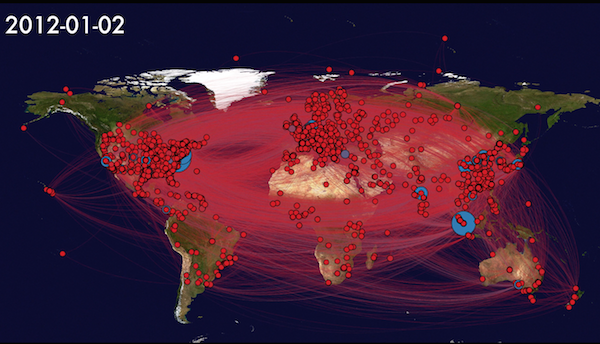
In the course Network Measurement and Analysis, we were assigned a project to visualize the Internet. This project is based on the data from Macroscopic Internet Technology Data Kit (ITDK) to complete some analysis on Autonomous Systems (ASes) over the Internet.
Autonomous Systems
Within the Internet, an Autonomous System (AS) is a collection of connected Internet Protocol (IP) routing prefixes under the control of one or more network operators that presents a common, clearly defined routing policy to the Internet.
Originally the definition required control by a single entity, typically an Internet service provider or a very large organization with independent connections to multiple networks, that adhere to a single and clearly defined routing policy, as originally defined in RFC 1771. The newer definition in RFC 1930 came into use because multiple organizations can run BGP using private AS numbers to an ISP that connects all those organizations to the Internet. Even though there may be multiple Autonomous Systems supported by the ISP, the Internet only sees the routing policy of the ISP. That ISP must have an officially registered Autonomous System Number (ASN).
The number of unique autonomous networks in the routing system of the Internet exceeded 42,000 in late 2012 according to Wikipedia.
Toolchains
The dataset is obtained from http://www.caida.org/data/internet-topology-data-kit/.
We first use a python script to convert the daily data to GEXF format. Meanwhile, it is necessary to combine the AS nodes in graph with their geographic locations. The locations of ASes can be also obtained from ITDK website.
Gephi is a terrific tool to visualize a graph. Then we use Gephi to generate png images.
The source code has been pushed to GitHub:
https://github.com/dangfan/itdk-visualize
Analysis on one-day AS links
The topology of AS links is shown in the following graph.

By using some basic graph algorithms, we found some interesting phenomena including:
- ASes those have more neighbors always have much more out-degree than in-degree.
- ASes those have higher in-degree always have higher out-degree and vice versa.
In this case, The maximum value of out-degree of all ASes is over 2,300 while all the in-degrees are less than 200.
Analysis on the whole-year AS links
By analysing all the images, we drew the following conclusions:
- The ASes are mainly located in North America, Europe, and East Asia.
- Only few nodes with higher degree.
- They are quite stable during the whole year.